Accountant Salary in Salem, OR: $89,763 (2026)
Quick Answer:A full-time accountant in Salem, OR earns a median $89,763/year (≈ $43.16/hour) in nominal terms for 2026 — projected from BLS OEWS 2025 (SOC 13-2011). Once you factor in Salem's price level (4% above national, BEA RPP 103.6), that paycheck buys what $86,603 would nationally. Nominal pay sits 7.2% above the Oregon state average.
Official BLS data · View source
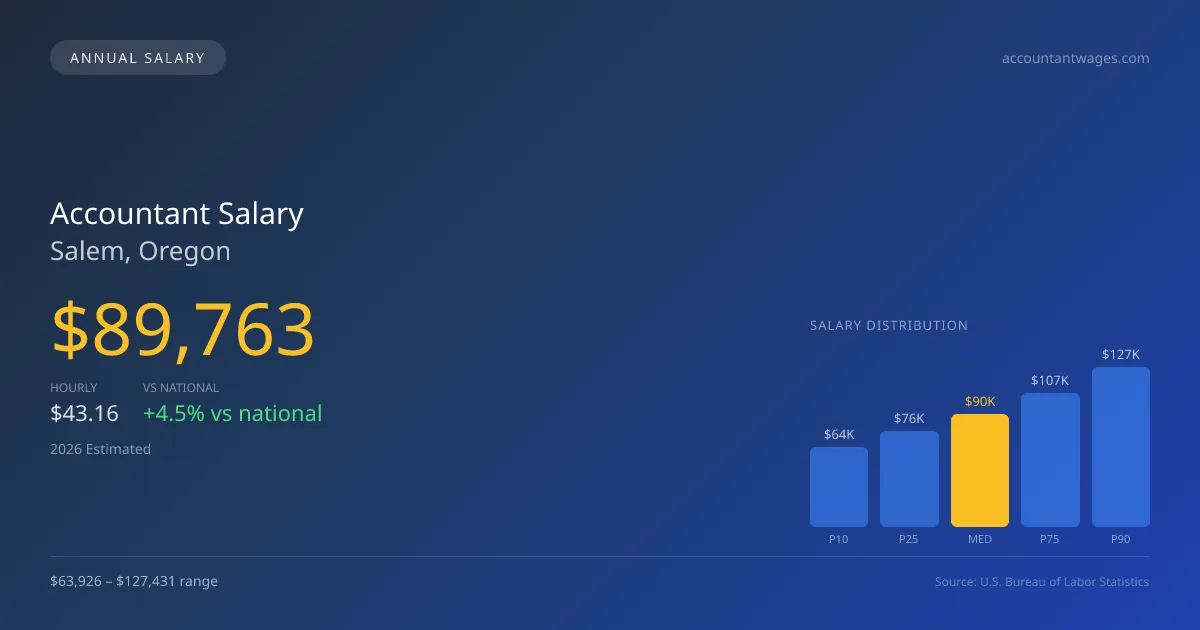
In 2026, the accountant salary in Salem, OR, is projected to reach a median of $89,763, surpassing the national median of $85,864 by approximately 4.54%. The salary range for accountants in the area is notably broad, with entry-level positions starting around $63,926 and seasoned professionals earning as much as $127,431. Derived from 2025 BLS OEWS data projected to 2026, these figures reflect a competitive local job market where accountants can expect strong career growth. This trend is supported by a steady annual growth rate of 2.61%, suggesting that opportunities in the accounting field will likely continue expanding, offering favorable conditions for both new entrants and established professionals.
Salary Breakdown
| Percentile | Annual | Hourly |
|---|---|---|
| Entry Level (P10) | $63,926 | $30.73 |
| Lower Range (P25) | $76,106 | $36.59 |
| Median (P50)(typical) | $89,763 | $43.16 |
| Upper Range (P75) | $106,868 | $51.38 |
| Top Earners (P90) | $127,431 | $61.27 |
Median Salary Position
4.54% above the national average
2026 Salary Percentile Distribution in Salem
In Salem, OR, the accountant salary spread from the 10th to 90th percentile is $63,505 (2026 est.). At $89,763, the local median is 4.54% above the national median of $85,864.
Salary Calculator
At 40 hours/week in Salem: You'd be in the lower-middle range
How Salem Accountant Pay Compares
Salem median: $89,763/year (2026)
| Compared To | Median Salary | Salem Pays |
|---|---|---|
| Oregon Average | $83,734 | +7.20% more |
| National Average | $85,864 | +4.54% more |
Accountants in Salem, OR earn a median of $89,763 per year (2026 est.), which is 4.54% higher than the national median of $85,864 and 7.20% above the Oregon state average of $83,734.
Cost-of-Living Adjusted Salary
Salem has a cost of living 3.65% above the national average.
Adjusted salary = nominal × (100 / CoL index). CoL index: 100 = national average.
Salem, OR has a cost-of-living index of 103.649 (above the national average of 100). While the nominal salary of $89,763 is competitive, the higher cost of living reduces purchasing power to an effective $86,603 — a 3.52% reduction.
Compare Purchasing Power
Select a city to see how your salary compares after cost of living
Select a city above to compare purchasing power
2019 BLS Actual
$67,770
2025 BLS Actual
$87,480
2026 Current Est.
$89,763
2019–2027 Growth
+35.9%
Salary Trajectory for Accountants in Salem (2019–2027)
2019–2025: actual BLS OEWS data for this metro area. 2026+: CAGR 2.61% projection.
| Year | Annual Salary | Status |
|---|---|---|
| 2019 | $67,770 | Actual |
| 2020 | $70,960 | Actual |
| 2021 | $77,030 | Actual |
| 2022 | $74,430 | Actual |
| 2023 | $78,630 | Actual |
| 2024 | $81,140 | Actual |
| 2025 | $87,480 | Actual |
| 2026(current) | $89,763 | Estimated |
| 2027 | $92,106 | Projected |
Based on 7 years of BLS OEWS data for the Salem metropolitan area, the median accountant salary grew 29.1% from $67,770 (2019) to $87,480 (2025). At a 2.61% compound annual growth rate, salaries are projected to reach $92,106 by 2027 — a total increase of $24,336 (35.91%) from 2019.
Note: Historical values (2019–2025) are actual BLS OEWS figures for the Salem metropolitan area, sourced from annual Occupational Employment and Wage Statistics surveys. 2026–2026 figures are current estimates, and 2027 values are projections, calculated using a 2.61% CAGR derived from 7-year BLS historical data. Actual salaries may vary based on employer, experience, certifications, and local market conditions.
Salary by Experience Level
| Experience | Estimated Salary Range |
|---|---|
| 0-2 years (New Graduate) | $63,926 – $76,106 |
| 3-5 years (Mid Career) | $76,106 – $89,763 |
| 5+ years (Experienced) | $89,763 – $106,868 |
| 10+ years (Top Earner) | $106,868 – $127,431 |
CPA salary ranges estimated from BLS percentile data. Individual accountant compensation varies by employer, certifications, and specialization.
Accountant Job Market in Salem
The local job market in Salem includes around 1,510 employed accountants, indicating a robust demand for financial expertise. The cost of living index is slightly above the national average at 103.649, which can impact the take-home purchasing power of accountants in the region. Among employers, larger public accounting firms, including the Big 4, offer higher compensation relative to smaller local firms and corporate accounting departments. The variance between salaries is influenced by factors such as the CPA license, firm tier, and specialization in areas like tax or forensic accounting. Accountants seeking to maximize their earnings may benefit from targeting positions within these higher-paying firms or pursuing additional certifications that support career advancement, particularly in Salem’s competitive market.
More salary data for Salem, OR:
Frequently Asked Questions
How much do accountants make in Salem, OR in 2026?
Is Salem, OR a good place to work as a accountant?
Can accountants make $100K in Salem?
What is the cost-of-living adjusted accountant salary in Salem?
How much does a accountant make per hour in Salem?
Related Pages
Compare Salaries
Career Resources
Nearby Cities in Oregon
Written by Sofia Patel, CPA
Career Analyst
Sofia Patel has over 10 years of experience in financial analysis. She specializes in tax preparation for small businesses. She has worked in both corporate and public accounting environments.
Methodology & Data Source
Salary figures on this page are 2026 projections based on the Bureau of Labor Statistics Occupational Employment and Wage Statistics (OEWS) survey, May 2026 release. The BLS reported a median annual salary of $87,480 for accountantsin the Salem metropolitan area. A 2.61% compound annual growth rate (CAGR), calculated from 6-year national BLS wage trends, was applied to project current 2026 compensation. Percentile ranges (P10–P90) represent the full salary distribution across experience levels and practice settings in this market.
Data Sources & Methodology
Source: BLS, OEWS, 7-year dataset (–). Per-city data from annual BLS metropolitan area surveys.
2026 figures are projected from 2025 BLS data using a compound annual growth rate (CAGR) of 2.61%, derived from historical BLS wage trends for accountants (SOC 13-2011).
Compiled and verified by Sofia Patel, CPA, a licensed accountant with 10+ years of clinical experience. · View source data at BLS.gov