Accountant Salary in Oregon: $91,735 (2026)
Quick Answer:Across Oregon's 36 metropolitan areas, the average median accountant pay sits at $91,735/year heading into 2026 — a figure projected from 2025 BLS OEWS wage data for SOC 13-2011. Because Oregon sits at BEA RPP 102.6 (3% above the U.S. baseline), that statewide median translates to roughly $89,410 in nationally-comparable purchasing power. Highest-paying metros: Hillsboro ($94,298), Portland ($92,200), Salem ($87,480).
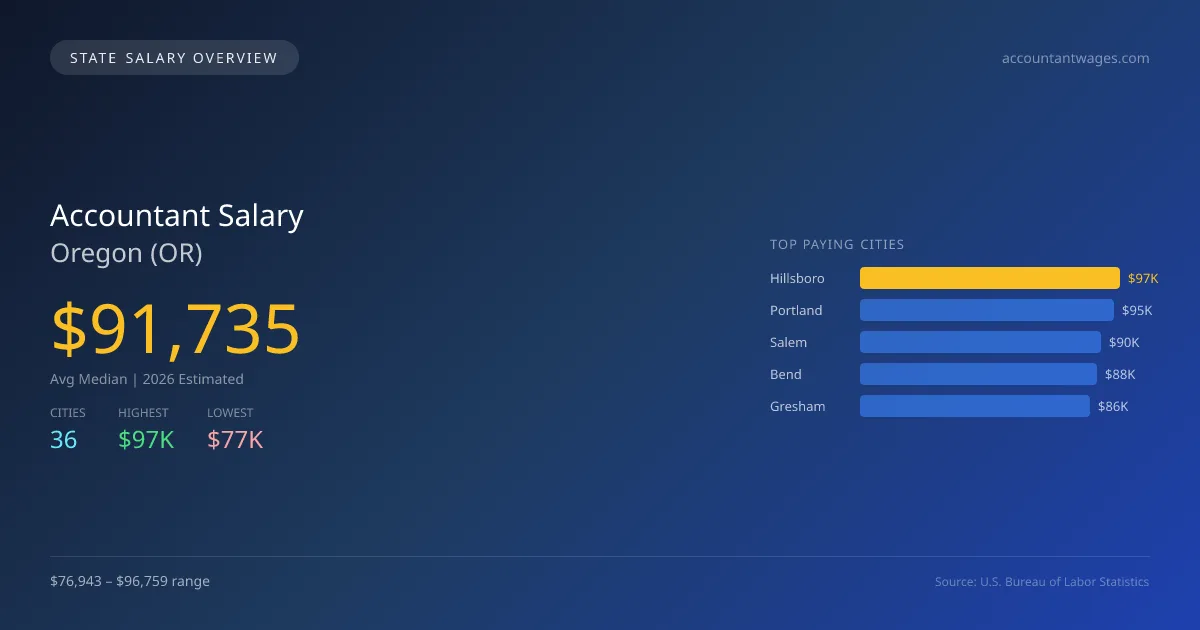
In 2026, the average median salary for accountants in Oregon is projected to be $91,734, which is 6.8% higher than the national median of $85,864. The salary landscape varies significantly across the state; Hillsboro tops the list with $96,759, while Milwaukie is at the lower end with $76,943, reflecting a salary gap of $19,816. This disparity can be attributed to factors such as the cost of living, demand for skilled accountants in different metro areas, and the presence of larger businesses and corporations in cities like Hillsboro and Portland. Oregon has specific state licensing requirements and scope of practice laws that may influence career paths for accountants. The job market is expected to grow at an annual rate of 2.61%, driven by the increasing complexity of financial regulations, a thriving business climate, and ongoing demand for accounting services across various sectors. Top projected salaries in other cities include Portland at $94,606, Salem at $89,763, Bend at $88,275, and Gresham at $85,663. With a total of 14,824 accountants employed in the state, opportunities are promising for those considering this career path in Oregon.
Oregon Accountant Salary Range
Overall salary range in Oregon: $52,746 (lowest entry-level) to $149,977 (highest top earner)
Oregon vs National Average
Oregon accountants earn 6.84% more than the national median (+$5,871/year difference).
Oregon Accountant Salary Distribution (2026)
Accountant salaries in Oregon range from $64,755 (entry-level, 10th percentile) to $136,554 (top earners, 90th percentile), with a median of $91,735. The Oregon median is $5,871 above the US national median of $85,864. The average hourly rate is $44.11/hr. Approximately 14,824 accountants are employed across 36 cities.
2019 BLS Actual
$68,200
2025 BLS Actual
$89,401
2026 Current Est.
$91,735
2019–2027 Growth
+38.0%
Salary Trajectory for Accountants in Oregon (2019–2027)
2019–2025: actual BLS OEWS data for this metro area. 2026+: CAGR 2.61% projection.
| Year | Annual Salary | Status |
|---|---|---|
| 2019 | $68,200 | Actual |
| 2020 | $72,058 | Actual |
| 2021 | $74,870 | Actual |
| 2022 | $75,977 | Actual |
| 2023 | $79,079 | Actual |
| 2024 | $82,552 | Actual |
| 2025 | $89,401 | Actual |
| 2026(current) | $91,735 | Estimated |
| 2027 | $94,129 | Projected |
Based on 7 years of BLS OEWS data for the Oregon metropolitan area, the median accountant salary grew 31.1% from $68,200 (2019) to $89,401 (2025). At a 2.61% compound annual growth rate, salaries are projected to reach $94,129 by 2027 — a total increase of $25,929 (38.02%) from 2019.
Note: Historical values (2019–2025) are actual BLS OEWS figures for the Oregon metropolitan area, sourced from annual Occupational Employment and Wage Statistics surveys. 2026–2026 figures are current estimates, and 2027 values are projections, calculated using a 2.61% CAGR derived from 7-year BLS historical data. Actual salaries may vary based on employer, experience, certifications, and local market conditions.
Top 5 Highest Paying Cities in Oregon
Lowest Paying Cities in Oregon
| City | Median Salary |
|---|---|
| Milwaukie | $76,943 |
| Klamath Falls | $77,126 |
| The Dalles | $77,592 |
| Newberg | $78,429 |
| Canby | $78,863 |
Best Value Cities for Accountants in Oregon
When adjusted for local cost of living, these Oregon cities offer the most purchasing power for accountants.
| City | Nominal Salary | CoL Index | Adjusted Salary |
|---|---|---|---|
| Hillsboro | $96,759 | 102.6 | $94,307 |
| Portland | $94,606 | 105.421 | $89,741 |
| Salem | $89,763 | 103.649 | $86,603 |
| Bend | $88,275 | 103.607 | $85,202 |
| Gresham | $85,663 | 102.6 | $83,492 |
Adjusted salary = nominal salary × (100 / CoL index). CoL index: 100 = national average. Lower index = lower cost of living.
Salary by Experience Level in Oregon
| Experience Level | Estimated Annual |
|---|---|
| Entry Level (0-2 years) | $64,755 |
| Mid Career (3-7 years) | $91,735 |
| Experienced (7+ years) | $136,554 |
Estimates based on BLS percentile data averaged across Oregon metro areas. Individual pay varies by employer, certifications, and specialization.
All 36 Cities in Oregon
| # | City | Median Salary |
|---|---|---|
| 1 | Hillsboro | $96,759 |
| 2 | Portland | $94,606 |
| 3 | Salem | $89,763 |
| 4 | Bend | $88,275 |
| 5 | Gresham | $85,663 |
| 6 | Albany | $84,109 |
| 7 | Medford | $83,330 |
| 8 | Beaverton | $83,224 |
| 9 | McMinnville | $82,998 |
| 10 | Oregon City | $82,901 |
| 11 | Woodburn | $82,348 |
| 12 | Eugene | $82,016 |
| 13 | Lake Oswego | $81,952 |
| 14 | Forest Grove | $81,737 |
| 15 | Tigard | $81,393 |
| 16 | Redmond | $81,367 |
| 17 | West Linn | $81,133 |
| 18 | Springfield | $80,956 |
| 19 | Tualatin | $80,432 |
| 20 | Pendleton | $80,425 |
| 21 | Wilsonville | $80,308 |
| 22 | Grants Pass | $80,108 |
| 23 | Happy Valley | $79,618 |
| 24 | Hermiston | $79,399 |
| 25 | Central Point | $79,361 |
| 26 | Ashland | $79,354 |
| 27 | Keizer | $79,334 |
| 28 | Sherwood | $79,329 |
| 29 | Corvallis | $79,215 |
| 30 | Coos Bay | $79,196 |
| 31 | Roseburg | $78,907 |
| 32 | Canby | $78,863 |
| 33 | Newberg | $78,429 |
| 34 | The Dalles | $77,592 |
| 35 | Klamath Falls | $77,126 |
| 36 | Milwaukie | $76,943 |
More Oregon Salary Data
Explore More Accountant Salary Data
Frequently Asked Questions
How much do accountants make in Oregon in 2026?
What is the highest paying city for accountants in Oregon?
How does Oregon accountant pay compare to the national average?
What is the entry-level accountant salary in Oregon?
How many accountants are employed in Oregon?
Which Oregon city offers the best value for accountants?
Written by Sofia Patel, CPA
Career Analyst
Sofia Patel has over 10 years of experience in financial analysis. She specializes in tax preparation for small businesses. She has worked in both corporate and public accounting environments.
Methodology & Data Source
Statewide salary figures on this page are 2026 projections based on the Bureau of Labor Statistics Occupational Employment and Wage Statistics (OEWS) survey, May 2026 release. A 2.61% compound annual growth rate (CAGR), derived from 6-year national BLS wage trends, was applied to each metro area's reported salary to estimate current 2026 accountant compensation across Oregon. State averages are employment-weighted across 36 metro areas — larger metro areas with more accountantscontribute proportionally more to the average, producing figures that better reflect typical compensation. Individual pay varies by city, employer, certifications, and experience.
Data Sources & Methodology
Source: BLS, OEWS, 7-year dataset (–). Per-city data from annual BLS metropolitan area surveys.
2026 figures are projected from 2025 BLS data using a compound annual growth rate (CAGR) of 2.61%, derived from historical BLS wage trends for accountants (SOC 13-2011).
Compiled and verified by Sofia Patel, CPA, a licensed accountant with 10+ years of clinical experience. · View source data at BLS.gov