Accountant Salary in Nevada: $83,537 (2026)
Quick Answer:Across Nevada's 9 metropolitan areas, the average median accountant pay sits at $83,537/year heading into 2026 — a figure projected from 2025 BLS OEWS wage data for SOC 13-2011. Because Nevada sits at BEA RPP 98.3 (2% below the U.S. baseline), that statewide median translates to roughly $84,982 in nationally-comparable purchasing power. Highest-paying metros: Carson City ($93,560), Sparks ($82,990), Reno ($82,370).
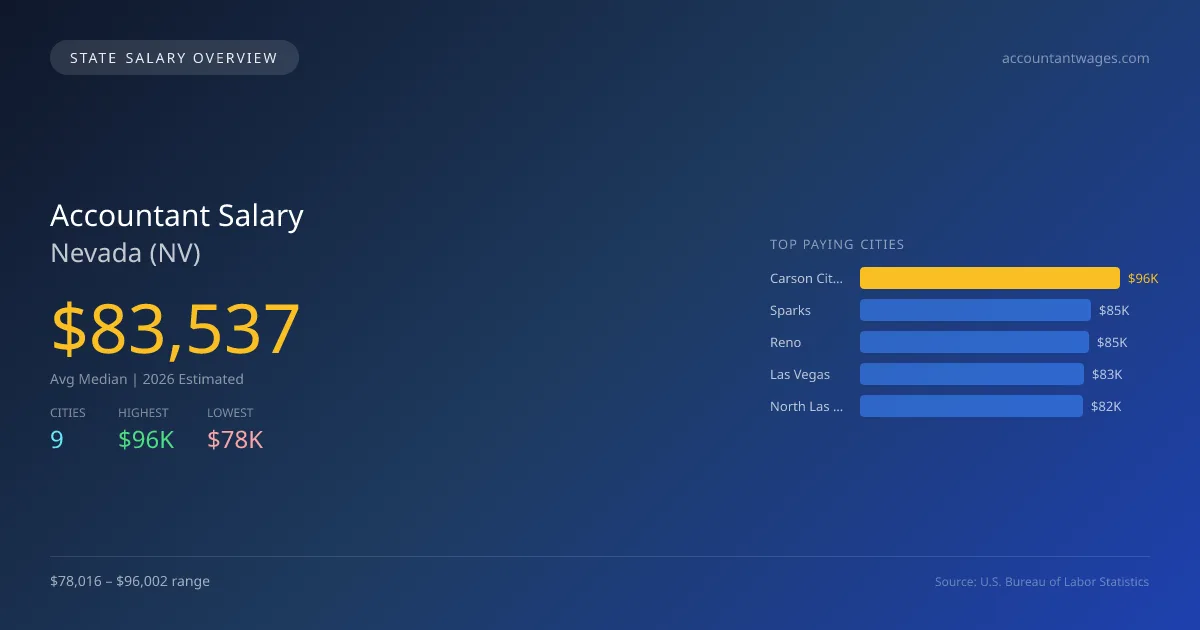
In 2026, the average median salary for accountants in Nevada is projected to be $83,537, which is slightly below the national median of $85,864, reflecting a difference of 2.7%. The highest-paying city for accountants in the state is Carson City, offering salaries of $96,002, while Fernley offers the lowest at $78,016, highlighting a salary gap of $17,986. This variance can be attributed to factors such as the local cost of living, demand for accounting services, and the concentration of businesses in each area. Accountants in Nevada must adhere to specific licensing requirements and regulations that govern their practice, which can influence job prospects and earning potential. Factors such as growth in industries like tourism and gaming, as well as a rising number of small businesses, are driving demand for accounting professionals. With an expected annual growth rate of 2.61% in accountant employment, the job market appears to be stable for aspiring accountants. Top cities for employment in 2026 include Sparks at $85,156, Reno at $84,520, Las Vegas at $82,632, and North Las Vegas at $82,285. Understanding these regional salary differences and the current job outlook can help you navigate your career path in accounting effectively.
Nevada Accountant Salary Range
Overall salary range in Nevada: $52,711 (lowest entry-level) to $138,585 (highest top earner)
Nevada vs National Average
Nevada accountants earn 2.71% less than the national median ($-2,327/year difference).
Nevada Accountant Salary Distribution (2026)
Accountant salaries in Nevada range from $59,714 (entry-level, 10th percentile) to $131,871 (top earners, 90th percentile), with a median of $83,537. The Nevada median is $2,327 below the US national median of $85,864. The average hourly rate is $40.16/hr. Approximately 6,561 accountants are employed across 9 cities.
2019 BLS Actual
$62,478
2025 BLS Actual
$81,412
2026 Current Est.
$83,537
2019–2027 Growth
+37.2%
Salary Trajectory for Accountants in Nevada (2019–2027)
2019–2025: actual BLS OEWS data for this metro area. 2026+: CAGR 2.61% projection.
| Year | Annual Salary | Status |
|---|---|---|
| 2019 | $62,478 | Actual |
| 2020 | $63,769 | Actual |
| 2021 | $61,565 | Actual |
| 2022 | $62,920 | Actual |
| 2023 | $71,349 | Actual |
| 2024 | $78,247 | Actual |
| 2025 | $81,412 | Actual |
| 2026(current) | $83,537 | Estimated |
| 2027 | $85,717 | Projected |
Based on 7 years of BLS OEWS data for the Nevada metropolitan area, the median accountant salary grew 30.3% from $62,478 (2019) to $81,412 (2025). At a 2.61% compound annual growth rate, salaries are projected to reach $85,717 by 2027 — a total increase of $23,239 (37.20%) from 2019.
Note: Historical values (2019–2025) are actual BLS OEWS figures for the Nevada metropolitan area, sourced from annual Occupational Employment and Wage Statistics surveys. 2026–2026 figures are current estimates, and 2027 values are projections, calculated using a 2.61% CAGR derived from 7-year BLS historical data. Actual salaries may vary based on employer, experience, certifications, and local market conditions.
Top 5 Highest Paying Cities in Nevada
Lowest Paying Cities in Nevada
| City | Median Salary |
|---|---|
| Fernley | $78,016 |
| Elko | $78,975 |
| Mesquite | $79,375 |
| Henderson | $81,861 |
| North Las Vegas | $82,285 |
Best Value Cities for Accountants in Nevada
When adjusted for local cost of living, these Nevada cities offer the most purchasing power for accountants.
| City | Nominal Salary | CoL Index | Adjusted Salary |
|---|---|---|---|
| Carson City | $96,002 | 98.13 | $97,831 |
| Sparks | $85,156 | 98.3 | $86,629 |
| North Las Vegas | $82,285 | 98.3 | $83,708 |
| Reno | $84,520 | 101.014 | $83,672 |
| Henderson | $81,861 | 98.3 | $83,277 |
Adjusted salary = nominal salary × (100 / CoL index). CoL index: 100 = national average. Lower index = lower cost of living.
Salary by Experience Level in Nevada
| Experience Level | Estimated Annual |
|---|---|
| Entry Level (0-2 years) | $59,714 |
| Mid Career (3-7 years) | $83,537 |
| Experienced (7+ years) | $131,871 |
Estimates based on BLS percentile data averaged across Nevada metro areas. Individual pay varies by employer, certifications, and specialization.
All 9 Cities in Nevada
| # | City | Median Salary |
|---|---|---|
| 1 | Carson City | $96,002 |
| 2 | Sparks | $85,156 |
| 3 | Reno | $84,520 |
| 4 | Las Vegas | $82,632 |
| 5 | North Las Vegas | $82,285 |
| 6 | Henderson | $81,861 |
| 7 | Mesquite | $79,375 |
| 8 | Elko | $78,975 |
| 9 | Fernley | $78,016 |
More Nevada Salary Data
Explore More Accountant Salary Data
Frequently Asked Questions
How much do accountants make in Nevada in 2026?
What is the highest paying city for accountants in Nevada?
How does Nevada accountant pay compare to the national average?
What is the entry-level accountant salary in Nevada?
How many accountants are employed in Nevada?
Which Nevada city offers the best value for accountants?
Written by Sofia Patel, CPA
Career Analyst
Sofia Patel has over 10 years of experience in financial analysis. She specializes in tax preparation for small businesses. She has worked in both corporate and public accounting environments.
Methodology & Data Source
Statewide salary figures on this page are 2026 projections based on the Bureau of Labor Statistics Occupational Employment and Wage Statistics (OEWS) survey, May 2026 release. A 2.61% compound annual growth rate (CAGR), derived from 6-year national BLS wage trends, was applied to each metro area's reported salary to estimate current 2026 accountant compensation across Nevada. State averages are employment-weighted across 9 metro areas — larger metro areas with more accountantscontribute proportionally more to the average, producing figures that better reflect typical compensation. Individual pay varies by city, employer, certifications, and experience.
Data Sources & Methodology
Source: BLS, OEWS, 7-year dataset (–). Per-city data from annual BLS metropolitan area surveys.
2026 figures are projected from 2025 BLS data using a compound annual growth rate (CAGR) of 2.61%, derived from historical BLS wage trends for accountants (SOC 13-2011).
Compiled and verified by Sofia Patel, CPA, a licensed accountant with 10+ years of clinical experience. · View source data at BLS.gov