Accountant Salary in Minnesota: $87,732 (2026)
Quick Answer:Across Minnesota's 44 metropolitan areas, the average median accountant pay sits at $87,732/year heading into 2026 — a figure projected from 2025 BLS OEWS wage data for SOC 13-2011. Because Minnesota sits at BEA RPP 98.5 (1% below the U.S. baseline), that statewide median translates to roughly $89,068 in nationally-comparable purchasing power. Highest-paying metros: Minneapolis ($86,500), St. Paul ($85,632), Bloomington ($84,967).
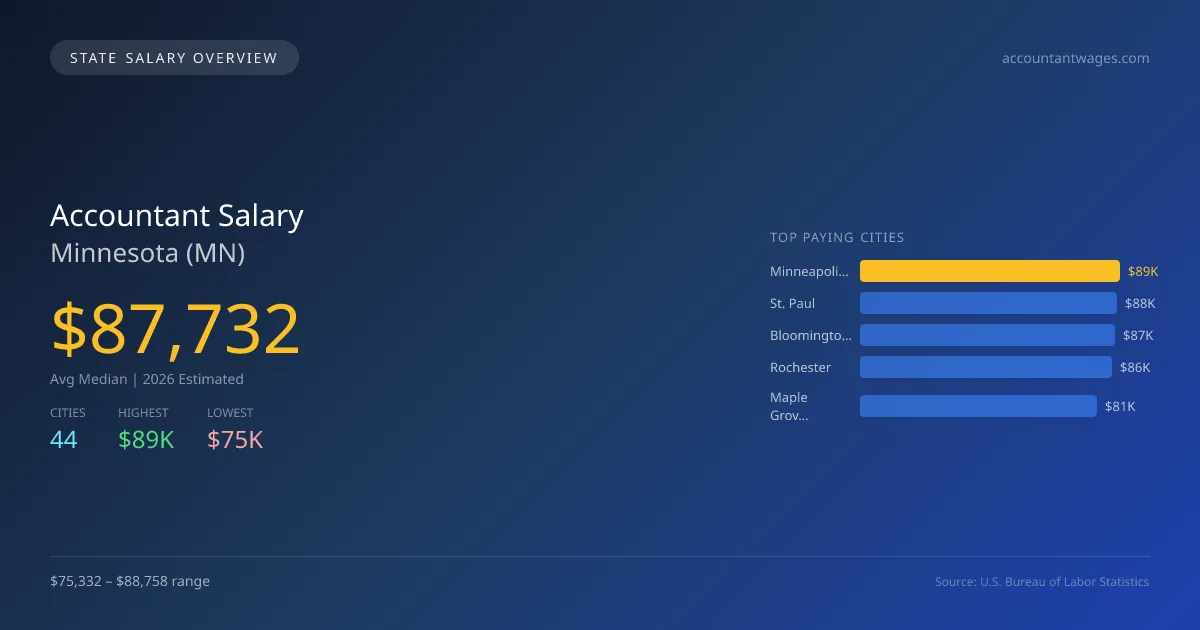
In 2026, the average median salary for accountants in Minnesota is projected to be $87,733, which is slightly above the national median of $85,864, resulting in a 2.2% premium. The highest salaries are found in Minneapolis at $88,758, while Faribault has the lowest at $75,332, creating a salary gap of $13,426 between these cities. This difference can be attributed to factors such as cost of living, demand for accounting services, and local economic conditions. Minnesota's accounting profession is subject to state licensing requirements and specific scope of practice laws that can affect practice and salaries. Demand for accountants is driven by factors like the state's diverse economy, which includes industries such as healthcare and manufacturing, prompting the need for financial oversight and reporting. The job market for accountants shows a positive outlook with a projected annual growth rate of 2.61%. With 25,162 accountants currently employed across 44 metro areas, opportunities exist in various cities. Aside from Minneapolis, salaries in top cities include St. Paul at $87,867, Bloomington at $87,185, Rochester at $86,151, and Maple Grove at $80,830, reflecting a healthy demand for accounting professionals throughout the state.
Minnesota Accountant Salary Range
Overall salary range in Minnesota: $49,639 (lowest entry-level) to $149,513 (highest top earner)
Minnesota vs National Average
Minnesota accountants earn 2.18% more than the national median (+$1,868/year difference).
Minnesota Accountant Salary Distribution (2026)
Accountant salaries in Minnesota range from $62,737 (entry-level, 10th percentile) to $146,676 (top earners, 90th percentile), with a median of $87,732. The Minnesota median is $1,868 above the US national median of $85,864. The average hourly rate is $42.18/hr. Approximately 25,162 accountants are employed across 44 cities.
2019 BLS Actual
$69,384
2025 BLS Actual
$85,501
2026 Current Est.
$87,732
2019–2027 Growth
+29.7%
Salary Trajectory for Accountants in Minnesota (2019–2027)
2019–2025: actual BLS OEWS data for this metro area. 2026+: CAGR 2.61% projection.
| Year | Annual Salary | Status |
|---|---|---|
| 2019 | $69,384 | Actual |
| 2020 | $71,396 | Actual |
| 2021 | $76,029 | Actual |
| 2022 | $77,383 | Actual |
| 2023 | $79,075 | Actual |
| 2024 | $82,407 | Actual |
| 2025 | $85,501 | Actual |
| 2026(current) | $87,732 | Estimated |
| 2027 | $90,022 | Projected |
Based on 7 years of BLS OEWS data for the Minnesota metropolitan area, the median accountant salary grew 23.2% from $69,384 (2019) to $85,501 (2025). At a 2.61% compound annual growth rate, salaries are projected to reach $90,022 by 2027 — a total increase of $20,638 (29.74%) from 2019.
Note: Historical values (2019–2025) are actual BLS OEWS figures for the Minnesota metropolitan area, sourced from annual Occupational Employment and Wage Statistics surveys. 2026–2026 figures are current estimates, and 2027 values are projections, calculated using a 2.61% CAGR derived from 7-year BLS historical data. Actual salaries may vary based on employer, experience, certifications, and local market conditions.
Top 5 Highest Paying Cities in Minnesota
Lowest Paying Cities in Minnesota
Best Value Cities for Accountants in Minnesota
When adjusted for local cost of living, these Minnesota cities offer the most purchasing power for accountants.
| City | Nominal Salary | CoL Index | Adjusted Salary |
|---|---|---|---|
| Rochester | $86,151 | 90.821 | $94,858 |
| St. Cloud | $79,748 | 87.632 | $91,003 |
| Duluth | $79,420 | 88.768 | $89,469 |
| St. Paul | $87,867 | 98.5 | $89,205 |
| Bloomington | $87,185 | 98.5 | $88,513 |
Adjusted salary = nominal salary × (100 / CoL index). CoL index: 100 = national average. Lower index = lower cost of living.
Salary by Experience Level in Minnesota
| Experience Level | Estimated Annual |
|---|---|
| Entry Level (0-2 years) | $62,737 |
| Mid Career (3-7 years) | $87,732 |
| Experienced (7+ years) | $146,676 |
Estimates based on BLS percentile data averaged across Minnesota metro areas. Individual pay varies by employer, certifications, and specialization.
All 44 Cities in Minnesota
| # | City | Median Salary |
|---|---|---|
| 1 | Minneapolis | $88,758 |
| 2 | St. Paul | $87,867 |
| 3 | Bloomington | $87,185 |
| 4 | Rochester | $86,151 |
| 5 | Maple Grove | $80,830 |
| 6 | Woodbury | $80,798 |
| 7 | Eden Prairie | $80,722 |
| 8 | St. Cloud | $79,748 |
| 9 | Duluth | $79,420 |
| 10 | Owatonna | $79,166 |
| 11 | Brooklyn Park | $79,062 |
| 12 | Plymouth | $78,922 |
| 13 | Roseville | $78,875 |
| 14 | Chaska | $78,814 |
| 15 | Minnetonka | $78,796 |
| 16 | Cottage Grove | $78,708 |
| 17 | Mankato | $78,661 |
| 18 | Burnsville | $78,644 |
| 19 | Lakeville | $78,354 |
| 20 | Chanhassen | $78,300 |
| 21 | Inver Grove Heights | $78,177 |
| 22 | Eagan | $78,164 |
| 23 | Brooklyn Center | $78,145 |
| 24 | Elk River | $78,132 |
| 25 | Prior Lake | $78,052 |
| 26 | Ramsey | $77,767 |
| 27 | Blaine | $77,439 |
| 28 | Apple Valley | $77,319 |
| 29 | Shakopee | $77,242 |
| 30 | Coon Rapids | $77,229 |
| 31 | Savage | $77,105 |
| 32 | Edina | $77,097 |
| 33 | Maplewood | $76,870 |
| 34 | Andover | $76,852 |
| 35 | Richfield | $76,815 |
| 36 | St. Louis Park | $76,809 |
| 37 | Moorhead | $76,697 |
| 38 | Northfield | $76,142 |
| 39 | Hastings | $75,980 |
| 40 | Fridley | $75,639 |
| 41 | Winona | $75,576 |
| 42 | Shoreview | $75,546 |
| 43 | Austin | $75,429 |
| 44 | Faribault | $75,332 |
More Minnesota Salary Data
Senior / Experienced
Top earner salaries for experienced accountants.
Compare Cities in Minnesota
View all comparisons →Explore More Accountant Salary Data
Frequently Asked Questions
How much do accountants make in Minnesota in 2026?
What is the highest paying city for accountants in Minnesota?
How does Minnesota accountant pay compare to the national average?
What is the entry-level accountant salary in Minnesota?
How many accountants are employed in Minnesota?
Which Minnesota city offers the best value for accountants?
Written by Sofia Patel, CPA
Career Analyst
Sofia Patel has over 10 years of experience in financial analysis. She specializes in tax preparation for small businesses. She has worked in both corporate and public accounting environments.
Methodology & Data Source
Statewide salary figures on this page are 2026 projections based on the Bureau of Labor Statistics Occupational Employment and Wage Statistics (OEWS) survey, May 2026 release. A 2.61% compound annual growth rate (CAGR), derived from 6-year national BLS wage trends, was applied to each metro area's reported salary to estimate current 2026 accountant compensation across Minnesota. State averages are employment-weighted across 44 metro areas — larger metro areas with more accountantscontribute proportionally more to the average, producing figures that better reflect typical compensation. Individual pay varies by city, employer, certifications, and experience.
Data Sources & Methodology
Source: BLS, OEWS, 7-year dataset (–). Per-city data from annual BLS metropolitan area surveys.
2026 figures are projected from 2025 BLS data using a compound annual growth rate (CAGR) of 2.61%, derived from historical BLS wage trends for accountants (SOC 13-2011).
Compiled and verified by Sofia Patel, CPA, a licensed accountant with 10+ years of clinical experience. · View source data at BLS.gov