Accountant Salary in Massachusetts: $101,474 (2026)
Quick Answer:Across Massachusetts's 59 metropolitan areas, the average median accountant pay sits at $101,474/year heading into 2026 — a figure projected from 2025 BLS OEWS wage data for SOC 13-2011. Because Massachusetts sits at BEA RPP 108.5 (9% above the U.S. baseline), that statewide median translates to roughly $93,524 in nationally-comparable purchasing power. Highest-paying metros: Boston ($100,150), Newton ($99,345), Cambridge ($97,758).
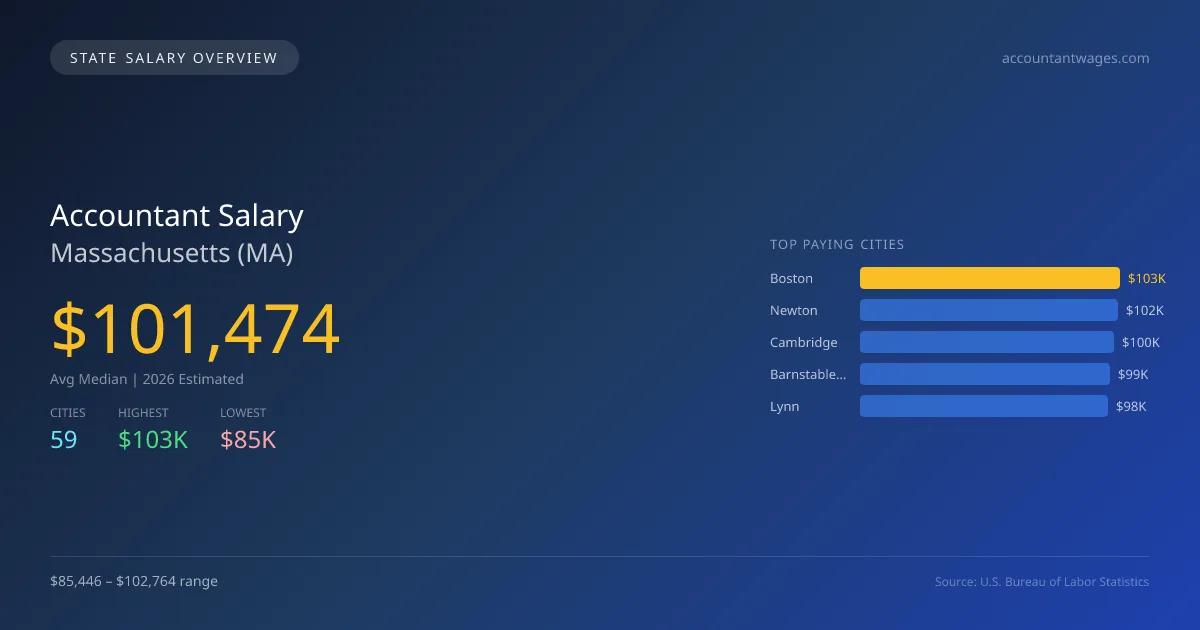
In 2026, the average median salary for accountants in Massachusetts is projected to be $101,474, significantly higher than the national median of $85,864, reflecting a difference of 18.2%. Boston offers the highest salaries at $102,764, while Northampton presents the lowest at $85,446, highlighting a salary gap of $17,318 that can be attributed to varying costs of living, demand for accounting services, and local market conditions. Massachusetts has specific licensing requirements and scope of practice laws that can also affect salaries and job opportunities in the field. The demand for accountants remains strong in the state, driven by a robust economy and the presence of numerous businesses and financial institutions. With a projected annual compound growth rate of 2.61%, the job market for accountants in Massachusetts continues to expand, suggesting a steady increase in employment opportunities. The top five cities for accountant salaries include Newton at $101,938, Cambridge at $100,309, Barnstable Town at $98,618, and Lynn at $98,054. Together, these figures indicate a healthy outlook for current and prospective accountants in the region.
Massachusetts Accountant Salary Range
Overall salary range in Massachusetts: $59,554 (lowest entry-level) to $165,664 (highest top earner)
Massachusetts vs National Average
Massachusetts accountants earn 18.18% more than the national median (+$15,610/year difference).
Massachusetts Accountant Salary Distribution (2026)
Accountant salaries in Massachusetts range from $72,778 (entry-level, 10th percentile) to $162,700 (top earners, 90th percentile), with a median of $101,474. The Massachusetts median is $15,610 above the US national median of $85,864. The average hourly rate is $48.79/hr. Approximately 44,277 accountants are employed across 59 cities.
2019 BLS Actual
$76,548
2025 BLS Actual
$98,893
2026 Current Est.
$101,474
2019–2027 Growth
+36.0%
Salary Trajectory for Accountants in Massachusetts (2019–2027)
2019–2025: actual BLS OEWS data for this metro area. 2026+: CAGR 2.61% projection.
| Year | Annual Salary | Status |
|---|---|---|
| 2019 | $76,548 | Actual |
| 2020 | $81,094 | Actual |
| 2021 | $80,949 | Actual |
| 2022 | $83,757 | Actual |
| 2023 | $89,676 | Actual |
| 2024 | $95,722 | Actual |
| 2025 | $98,893 | Actual |
| 2026(current) | $101,474 | Estimated |
| 2027 | $104,122 | Projected |
Based on 7 years of BLS OEWS data for the Massachusetts metropolitan area, the median accountant salary grew 29.2% from $76,548 (2019) to $98,893 (2025). At a 2.61% compound annual growth rate, salaries are projected to reach $104,122 by 2027 — a total increase of $27,574 (36.02%) from 2019.
Note: Historical values (2019–2025) are actual BLS OEWS figures for the Massachusetts metropolitan area, sourced from annual Occupational Employment and Wage Statistics surveys. 2026–2026 figures are current estimates, and 2027 values are projections, calculated using a 2.61% CAGR derived from 7-year BLS historical data. Actual salaries may vary based on employer, experience, certifications, and local market conditions.
Top 5 Highest Paying Cities in Massachusetts
Lowest Paying Cities in Massachusetts
| City | Median Salary |
|---|---|
| Northampton | $85,446 |
| Amherst Town | $86,593 |
| Pittsfield | $86,849 |
| Andover | $90,393 |
| Leominster | $90,615 |
Best Value Cities for Accountants in Massachusetts
When adjusted for local cost of living, these Massachusetts cities offer the most purchasing power for accountants.
| City | Nominal Salary | CoL Index | Adjusted Salary |
|---|---|---|---|
| Barnstable Town | $98,618 | 98.351 | $100,271 |
| Springfield | $94,411 | 96.061 | $98,282 |
| Boston | $102,764 | 108.266 | $94,918 |
| Worcester | $96,525 | 102.523 | $94,150 |
| Newton | $101,938 | 108.5 | $93,952 |
Adjusted salary = nominal salary × (100 / CoL index). CoL index: 100 = national average. Lower index = lower cost of living.
Salary by Experience Level in Massachusetts
| Experience Level | Estimated Annual |
|---|---|
| Entry Level (0-2 years) | $72,778 |
| Mid Career (3-7 years) | $101,474 |
| Experienced (7+ years) | $162,700 |
Estimates based on BLS percentile data averaged across Massachusetts metro areas. Individual pay varies by employer, certifications, and specialization.
All 59 Cities in Massachusetts
| # | City | Median Salary |
|---|---|---|
| 1 | Boston | $102,764 |
| 2 | Newton | $101,938 |
| 3 | Cambridge | $100,309 |
| 4 | Barnstable Town | $98,618 |
| 5 | Lynn | $98,054 |
| 6 | Somerville | $96,770 |
| 7 | Revere | $96,620 |
| 8 | Worcester | $96,525 |
| 9 | Brockton | $96,288 |
| 10 | New Bedford | $96,180 |
| 11 | Plymouth | $96,120 |
| 12 | Malden | $95,772 |
| 13 | Haverhill | $95,758 |
| 14 | Lowell | $95,733 |
| 15 | Framingham | $95,689 |
| 16 | Peabody | $95,561 |
| 17 | Weymouth | $95,273 |
| 18 | Chicopee | $94,986 |
| 19 | Randolph | $94,882 |
| 20 | Quincy | $94,714 |
| 21 | Amherst | $94,601 |
| 22 | Chelsea | $94,593 |
| 23 | Springfield | $94,411 |
| 24 | Medford | $94,336 |
| 25 | Fall River | $94,245 |
| 26 | Marlborough | $94,245 |
| 27 | Watertown | $94,231 |
| 28 | Fitchburg | $94,156 |
| 29 | Methuen | $94,120 |
| 30 | Taunton | $94,079 |
| 31 | Arlington | $94,045 |
| 32 | Needham | $93,801 |
| 33 | Westfield | $93,756 |
| 34 | Everett | $93,741 |
| 35 | Holyoke | $93,260 |
| 36 | Beverly | $93,104 |
| 37 | Lawrence | $93,103 |
| 38 | Dartmouth | $92,993 |
| 39 | Waltham | $92,899 |
| 40 | Barnstable | $92,800 |
| 41 | Brookline | $92,597 |
| 42 | Billerica | $92,453 |
| 43 | Braintree | $92,142 |
| 44 | Salem | $91,986 |
| 45 | Natick | $91,926 |
| 46 | Dracut | $91,445 |
| 47 | Lexington | $91,385 |
| 48 | Stoughton | $91,385 |
| 49 | Shrewsbury | $91,267 |
| 50 | Franklin | $91,022 |
| 51 | Attleboro | $90,948 |
| 52 | Woburn | $90,830 |
| 53 | Chelmsford | $90,748 |
| 54 | Wellesley | $90,697 |
| 55 | Leominster | $90,615 |
| 56 | Andover | $90,393 |
| 57 | Pittsfield | $86,849 |
| 58 | Amherst Town | $86,593 |
| 59 | Northampton | $85,446 |
More Massachusetts Salary Data
Compare Cities in Massachusetts
View all comparisons →Explore More Accountant Salary Data
Frequently Asked Questions
How much do accountants make in Massachusetts in 2026?
What is the highest paying city for accountants in Massachusetts?
How does Massachusetts accountant pay compare to the national average?
What is the entry-level accountant salary in Massachusetts?
How many accountants are employed in Massachusetts?
Which Massachusetts city offers the best value for accountants?
Written by Sofia Patel, CPA
Career Analyst
Sofia Patel has over 10 years of experience in financial analysis. She specializes in tax preparation for small businesses. She has worked in both corporate and public accounting environments.
Methodology & Data Source
Statewide salary figures on this page are 2026 projections based on the Bureau of Labor Statistics Occupational Employment and Wage Statistics (OEWS) survey, May 2026 release. A 2.61% compound annual growth rate (CAGR), derived from 6-year national BLS wage trends, was applied to each metro area's reported salary to estimate current 2026 accountant compensation across Massachusetts. State averages are employment-weighted across 59 metro areas — larger metro areas with more accountantscontribute proportionally more to the average, producing figures that better reflect typical compensation. Individual pay varies by city, employer, certifications, and experience.
Data Sources & Methodology
Source: BLS, OEWS, 7-year dataset (–). Per-city data from annual BLS metropolitan area surveys.
2026 figures are projected from 2025 BLS data using a compound annual growth rate (CAGR) of 2.61%, derived from historical BLS wage trends for accountants (SOC 13-2011).
Compiled and verified by Sofia Patel, CPA, a licensed accountant with 10+ years of clinical experience. · View source data at BLS.gov