Accountant Salary in Illinois: $83,975 (2026)
Quick Answer:Across Illinois's 65 metropolitan areas, the average median accountant pay sits at $83,975/year heading into 2026 — a figure projected from 2025 BLS OEWS wage data for SOC 13-2011. Because Illinois sits at BEA RPP 97.1 (3% below the U.S. baseline), that statewide median translates to roughly $86,483 in nationally-comparable purchasing power. Highest-paying metros: Springfield ($86,440), Naperville ($83,220), Chicago ($82,360).
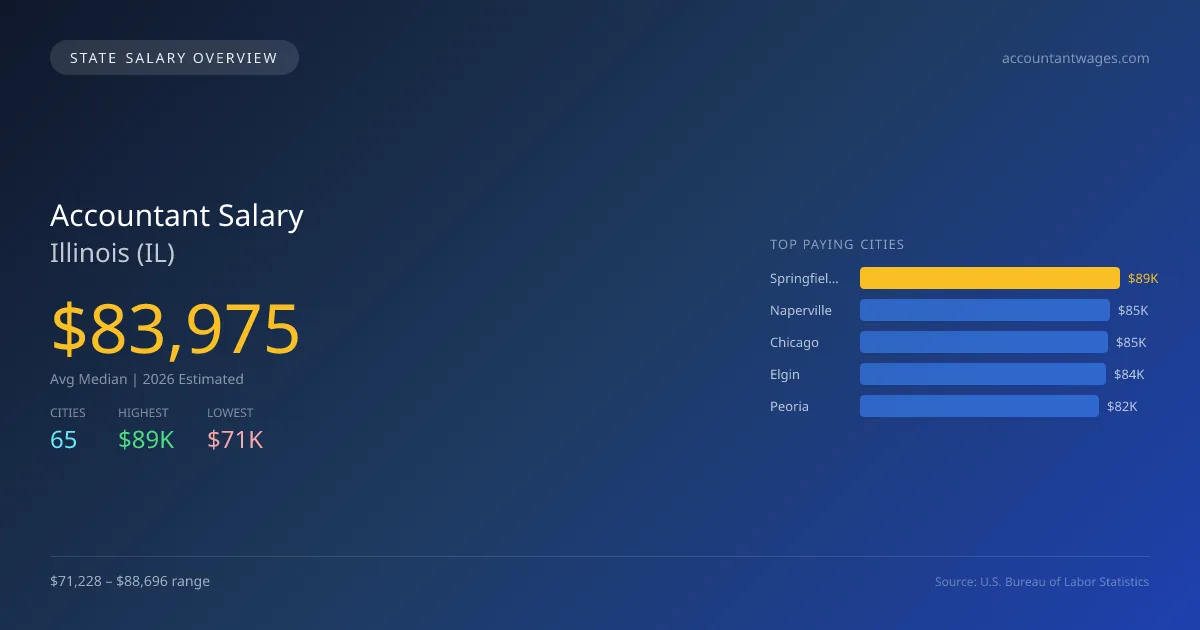
In 2026, the average median salary for accountants in Illinois is projected to be $83,975, slightly below the national median of $85,864 by 2.2%. The highest paying city for accountants is Springfield at $88,696, while Urbana offers the lowest salary at $71,228, creating a salary gap of $17,468. This difference can be attributed to factors such as the cost of living, demand for accounting services, and the concentration of businesses within metropolitan areas. Illinois has specific licensing requirements for accountants, which include passing the CPA exam and meeting education standards, thus ensuring a high level of professional competence. The demand for accountants is driven by a growing economy and the ongoing need for financial compliance, positioning the job market favorably with a projected growth rate of 2.61%. The top five cities with the highest projected salaries for accountants in 2026 are Springfield, Naperville at $85,392, Chicago at $84,510, Elgin at $83,755, and Peoria at $81,616. As the profession continues to evolve, those considering a career in accounting in Illinois can expect opportunities for growth and advancement in various sectors.
Illinois Accountant Salary Range
Overall salary range in Illinois: $48,947 (lowest entry-level) to $145,285 (highest top earner)
Illinois vs National Average
Illinois accountants earn 2.2% less than the national median ($-1,889/year difference).
Illinois Accountant Salary Distribution (2026)
Accountant salaries in Illinois range from $60,130 (entry-level, 10th percentile) to $136,367 (top earners, 90th percentile), with a median of $83,975. The Illinois median is $1,889 below the US national median of $85,864. The average hourly rate is $40.38/hr. Approximately 47,721 accountants are employed across 65 cities.
2019 BLS Actual
$71,341
2025 BLS Actual
$81,839
2026 Current Est.
$83,975
2019–2027 Growth
+20.8%
Salary Trajectory for Accountants in Illinois (2019–2027)
2019–2025: actual BLS OEWS data for this metro area. 2026+: CAGR 2.61% projection.
| Year | Annual Salary | Status |
|---|---|---|
| 2019 | $71,341 | Actual |
| 2020 | $72,259 | Actual |
| 2021 | $75,920 | Actual |
| 2022 | $76,917 | Actual |
| 2023 | $78,338 | Actual |
| 2024 | $80,571 | Actual |
| 2025 | $81,839 | Actual |
| 2026(current) | $83,975 | Estimated |
| 2027 | $86,167 | Projected |
Based on 7 years of BLS OEWS data for the Illinois metropolitan area, the median accountant salary grew 14.7% from $71,341 (2019) to $81,839 (2025). At a 2.61% compound annual growth rate, salaries are projected to reach $86,167 by 2027 — a total increase of $14,826 (20.78%) from 2019.
Note: Historical values (2019–2025) are actual BLS OEWS figures for the Illinois metropolitan area, sourced from annual Occupational Employment and Wage Statistics surveys. 2026–2026 figures are current estimates, and 2027 values are projections, calculated using a 2.61% CAGR derived from 7-year BLS historical data. Actual salaries may vary based on employer, experience, certifications, and local market conditions.
Top 5 Highest Paying Cities in Illinois
Lowest Paying Cities in Illinois
| City | Median Salary |
|---|---|
| Urbana | $71,228 |
| Champaign | $71,488 |
| Kankakee | $73,479 |
| Carbondale | $73,635 |
| Elmhurst | $74,368 |
Best Value Cities for Accountants in Illinois
When adjusted for local cost of living, these Illinois cities offer the most purchasing power for accountants.
| City | Nominal Salary | CoL Index | Adjusted Salary |
|---|---|---|---|
| Springfield | $88,696 | 92.745 | $95,634 |
| Peoria | $81,616 | 91.231 | $89,461 |
| Decatur | $78,722 | 88.422 | $89,030 |
| Naperville | $85,392 | 97.1 | $87,942 |
| Elgin | $83,755 | 97.1 | $86,256 |
Adjusted salary = nominal salary × (100 / CoL index). CoL index: 100 = national average. Lower index = lower cost of living.
Salary by Experience Level in Illinois
| Experience Level | Estimated Annual |
|---|---|
| Entry Level (0-2 years) | $60,130 |
| Mid Career (3-7 years) | $83,975 |
| Experienced (7+ years) | $136,367 |
Estimates based on BLS percentile data averaged across Illinois metro areas. Individual pay varies by employer, certifications, and specialization.
All 65 Cities in Illinois
More Illinois Salary Data
Senior / Experienced
Top earner salaries for experienced accountants.
Compare Cities in Illinois
View all comparisons →Explore More Accountant Salary Data
Frequently Asked Questions
How much do accountants make in Illinois in 2026?
What is the highest paying city for accountants in Illinois?
How does Illinois accountant pay compare to the national average?
What is the entry-level accountant salary in Illinois?
How many accountants are employed in Illinois?
Which Illinois city offers the best value for accountants?
Written by Sofia Patel, CPA
Career Analyst
Sofia Patel has over 10 years of experience in financial analysis. She specializes in tax preparation for small businesses. She has worked in both corporate and public accounting environments.
Methodology & Data Source
Statewide salary figures on this page are 2026 projections based on the Bureau of Labor Statistics Occupational Employment and Wage Statistics (OEWS) survey, May 2026 release. A 2.61% compound annual growth rate (CAGR), derived from 6-year national BLS wage trends, was applied to each metro area's reported salary to estimate current 2026 accountant compensation across Illinois. State averages are employment-weighted across 65 metro areas — larger metro areas with more accountantscontribute proportionally more to the average, producing figures that better reflect typical compensation. Individual pay varies by city, employer, certifications, and experience.
Data Sources & Methodology
Source: BLS, OEWS, 7-year dataset (–). Per-city data from annual BLS metropolitan area surveys.
2026 figures are projected from 2025 BLS data using a compound annual growth rate (CAGR) of 2.61%, derived from historical BLS wage trends for accountants (SOC 13-2011).
Compiled and verified by Sofia Patel, CPA, a licensed accountant with 10+ years of clinical experience. · View source data at BLS.gov